Purpose
Problem sets are designed for you to test your own conceptual understanding of the material. They provide a skeleton of relevant information from lecture and workshop for you to use as a reference when you are completing homeworks and exams, which are more formal presentations of your understanding.
Set up
You may turn in your problem set in .pdf or .docx format. This can be generated using code in a .qmd or .Rmd file, or a regular Word or Google Docs document.
A complete problem set will include:
- your name and the date
- the title (“Problem set 1”)
- answers to each problem component in the listed order (e.g. 1a, 1b, 1c, and so on)
- all answers visible with no missing components
Additionally, a complete problem set must be accompanied by a Generative AI statement of use (linked in the portal on Canvas).
Any problem set missing these components will be marked incomplete. See the syllabus for information on how missing problem sets) factor into your course grade.
Answer keys
Answers will not be posted. To compare your problem set against a paper copy of the key, you may:
- stop by drop-in hours with anyone on the instructional team (Allison, Matt, Abigail, or An)
- make a one-on-one meeting with An (via the meeting link on Canvas) or Allison based on our availability
Problems
1. Categorizing variables
For each of the following variables, name i) what kind of variable it is and ii) why.
Date for a study takes place over 3 days (11 November, 15 December, 13 January) with one observation of frog count per day
Time for a study that takes place over 24 hours with one measurement of water temperature every 15 minutes (e.g. 04:15, 06:30, 18:45)
Scale of 1-5 in whole numbers where 1 is strongly disagree, 3 is neither agree nor disagree, and 5 is strongly agree
Count of whale sharks per day along migratory route in Baja California, Mexico (e.g. 4 whale sharks per day, 10 whale sharks per day, 0 whale sharks per day)
Category of elevation gain on a hike: high, medium, or no elevation gain
Year for a study that takes place over 32 years, where researchers estimate giant kelp biomass once a year (e.g. 1993, 2001, 2022)
Height of an oak tree, measured in meters to the nearest whole meter (e.g. 1 m, 4 m, 25 m)
2. Central tendency and spread
- What units would you use for:
- Mean
- Median
- Mode
- Standard deviation
- Variance
- Range
- What functions could you use to calculate:
- Mean
- Median
- Mode
- Standard deviation
- Variance
- Range
3. Data visualization
What is on the x-axis of a histogram? What is on the y-axis of a histogram?
What is on the x-axis of a timeseries? What is on the y-axis of a timeseries?
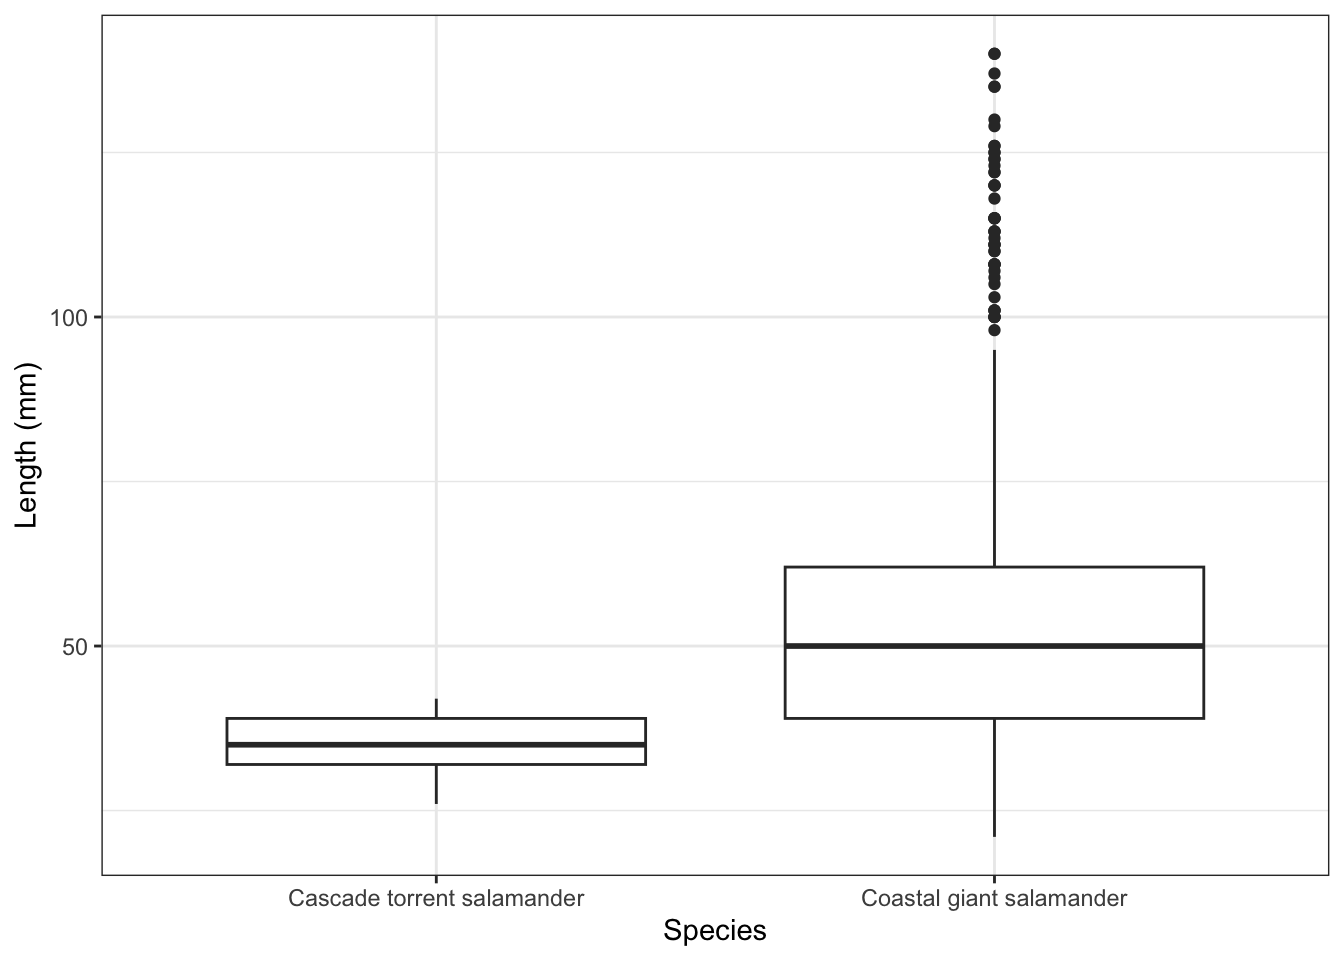
Label each component of this boxplot with what it represents mathematically.
If you wanted to compare median vegetation height (cm) across 1) burned grasslands, 2) unburned grasslands, and 3) shrublands, what kind of figure would you create and why?
If you wanted to understand the relationship between soil salinity (measured in mS/cm) and nitrogen concentration (measured in parts per million), what kind of figure would you create and why?
If you wanted to see how bird species richness (i.e. species number) changed through time, what kind of figure would you create and why?
4. Data usage
This is a data set at the Quebrada Sonadora site in the Luqillo Mountains, Puerto Rico measured by researchers at the Luqillo Experimental Forest. The researchers measured stream chemistry parameters every week.
# A tibble: 10 × 9
   sample_date  year  temp    na no3_n   p_h    ca     k    mg
   <date>      <dbl> <dbl> <dbl> <dbl> <dbl> <dbl> <dbl> <dbl>
 1 1988-03-15   1988    20  4.8    165  7.07  2.32  0.18  1.51
 2 1989-06-06   1989    21  4.22    82  7.35  1.88  0.26  1.19
 3 1988-11-07   1988    22  4.51    94  6.93  2.37  0.25  1.36
 4 1989-05-16   1989    22  4.66    82  6.56  2.32  0.31  1.34
 5 1987-07-14   1987    23  4.63    82  6.71  2.39  0.21  1.38
 6 1989-10-03   1989    22  5.24    37  7.09  2.43  0.47  1.44
 7 1989-09-12   1989    22  3.55    47  7.03  1.66  0.27  1.07
 8 1990-02-06   1990    19  5.8    233  6.34  2.7   0.58  1.63
 9 1987-12-22   1987    20  3.68    99  7.04  1.55  0.23  1.03
10 1989-07-11   1989    22  4.55    58  7.33  2.03  0.37  1.23
What does each column in this data set represent? What does each row represent? Be specific about time period of the observation.
There’s no metadata (information about the data) available to you, but what is your best guess for what the values in the
na,no3_n,p_h,ca,k, andmgcolumns represent? Be specific regarding the compounds or elements that the researchers may have measured.If you wanted to create a histogram of stream temperature, which column(s) would you use? Which geometry?
If you wanted to create a timeseries of calcium concentration through time, which column(s) would you use? Which geometry (name the specific function)?
If you wanted to explore the potential relationship between potassium and pH, which column(s) would you use? Which geometry (name the specific function)?
If you wanted to create a boxplot comparing magnesium concentration across years, which columns would you use? Which geometry (name the specific function)?
5. Metadata
The dataset in the above section on “Data usage” is from the lterdatasampler package, but the original dataset is from here:
McDowell, W. and International Institute of Tropical Forestry(IITF), USDA Forest Service.. 2024. Chemistry of stream water from the Luquillo Mountains ver 4923064. Environmental Data Initiative. https://doi.org/10.6073/pasta/f31349bebdc304f758718f4798d25458 (Accessed 2026-03-26).
All datasets are associated with “metadata”, or information about the data.
Before you start this problem, read this description of metadata to understand what it is.
Then, click through to the “Introduction to Metadata” page (under “Learn”) and read the questions that you should be able to answer with metadata.
For the stream water chemistry data, answer the following questions based on:
Who collected the data?
What are the data about?
What is the purpose or goal of collecting this data?
Where are the data located?
When were the data processed?
How do I access the data?