ENVS 193DS
Artwork by @allison_horst
Course description
Environmental scientists use data to understand the world around them. In this class, we’ll learn about the tools used in environmental science and beyond to work with, analyze, and communicate about data.
By the end of the quarter, students will be able to:
1. Describe basic concepts of probability and statistics
2. Identify appropriate statistical analyses to test hypotheses
3. Conduct statistical analyses and visualize data using the R programming language
4. Implement best practices for reproducible analysis and collaborative work
5. Interpret and contextualize statistical results in general concepts from environmental studies
Teaching team
Instructor

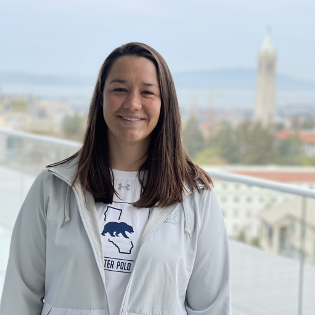
Name: An Bui
Forms of address: An (preferred), Dr. Bui, Professor Bui
Email: an_bui [at] ucsb [dot] edu
Drop-in hours: Thursdays 12:30 - 2:30 PM
Drop-in location: At the tables outside the UCen 1st floor (facing the lagoon)
More about me: an-bui.com
Teaching assistant
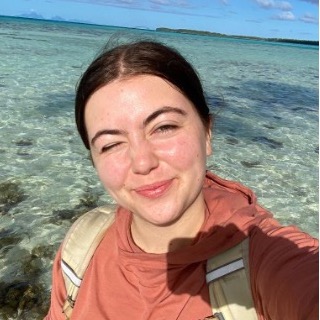
Name: Allison Larko
Forms of address: Allison
Email: allisonlarko [at] ucsb [dot] edu
Drop-in hours: Wednesdays 2:15 - 3:15 PM
Drop-in location: Bren Hall, Deckers Terrace (2nd floor, outdoors, facing the ocean)
More about me: LinkedIn
Undergraduate learning assistants

Name: Matthew Roco-Calvo
Forms of address: Matt
Drop-in hours: Fridays 10:50 - 11:50 AM
Drop-in location: HSSB courtyard
More about me: LinkedIn
Name: Abigail Youngblood
Forms of address: Abigail
Drop-in hours: Wednesdays 4-5 PM
Drop-in location: UCEN (tables in front of Subway)
More about me: LinkedIn
Acknowledgements
I took much of my inspiration for this course from Allison Horst’s Environmental Data Science and Statistics course, Sam Sambado’s Biometry course, and Sam Shanny-Csik’s Data Visualization and Communication course.